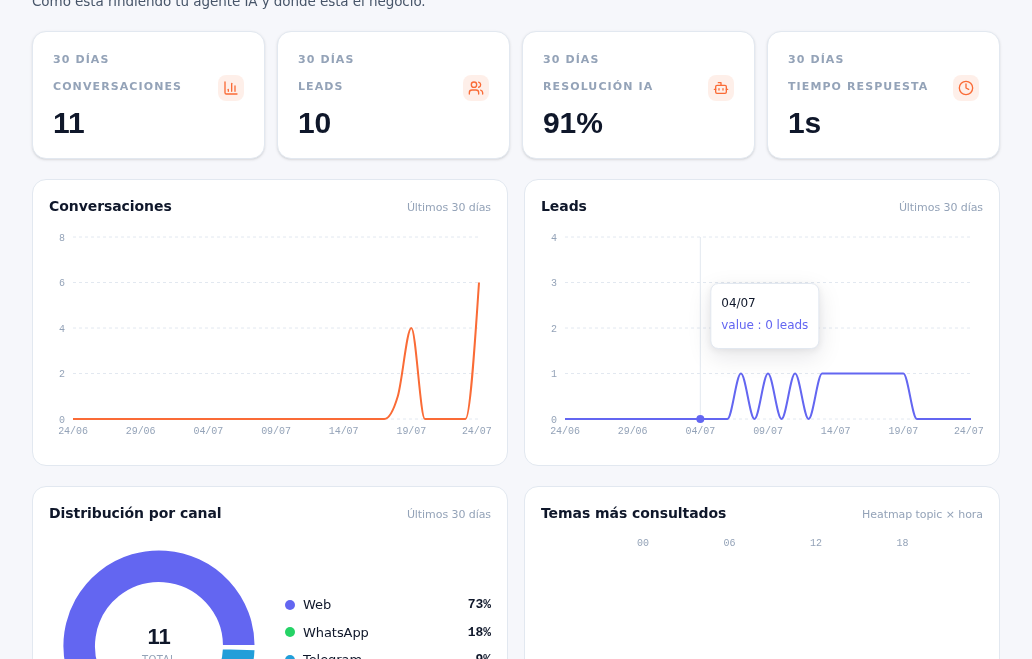
Requirements: none, available to any role.
- Go into Analytics.
- Choose the range you want to review: Today, 7 days, 30 days (checked by default) or 90 days.
- Read the four cards in the top row, each with the chosen range’s label (for example “30 DAYS”), an icon and a large value.
Result: a quick glance at the period’s performance, before diving into the charts’ detail.
| Indicator | What it measures |
|---|---|
| Conversations | How many conversations there have been in the period, on any channel (web, WhatsApp, Telegram or voice). |
| Leads | How many leads have been captured in the period (by the AI or created by hand — manual 14 · Manual leads). |
| AI resolution | Percentage of the period’s conversations the AI resolved without a person stepping in — the rest are the ones handed off to an operator (manual 16 · Conversations, the handoff section). |
| Response time | The period’s average response time, in seconds. |